
In October 2026, the U.S. index and the market beneath it were telling different stories. BlackRock noted on October 12 that 10 of 11 sectors had been flat or negative in September while a small group of technology and AI names supported the large-cap index. Vanguard's October 9 example shows an unrebalanced portfolio that began at 60% stocks and 40% bonds in 2021 drifting to roughly 73% and 27% by October 2, 2026.
A portfolio's risk can change even while its return looks strong. Here, improving performance does not mean guessing the next rising stock. It means seeking more expected return for the same risk, less loss potential for the same expected return, and less return lost to costs. The formulas and examples below are general design tools, not promises of future performance.
Define the objective before the annual return
Concentration can look attractive when performance is judged by annual return alone. Recovery becomes much harder after a large loss: a 20% decline requires a 25% gain, while a 50% decline requires a 100% gain. A useful objective therefore includes expected return, volatility, maximum drawdown, investment horizon and interim cash needs.
The Sharpe ratio, `(portfolio return-risk-free return)÷volatility`, is a common starting point. At the same return, lower volatility raises the ratio; at the same volatility, higher return raises it. Volatility is not the whole loss distribution, however. Tail losses, currency exposure, liquidity and taxes need separate limits.
Markowitz and estimation error
In Markowitz's 1952 paper, expected portfolio return can be written as `E(Rp)=ΣwiE(Ri)` and variance as `σp²=w'Σw`. The first equation adds expected asset returns by weight. The second includes not just each holding's volatility but covariance, or how holdings move together. Owning more securities does not create much diversification if they respond to the same sector, rate environment or AI capital-spending cycle.
The efficient frontier is the boundary of portfolios with the highest expected return for a given level of risk. Its output is highly sensitive to inputs. Using a five-year average rather than a ten-year average can materially change the optimum, so a weight printed to two decimal places is not a forecast. For an individual investor, position caps and conservative assumptions for covariance and costs can be more useful than fragile return estimates.
| Tool | Formula or rule | Useful for | Easy to miss |
|---|---|---|---|
| Mean-variance | max w'μ - λ/2·w'Σw | Trade-off between expected return and volatility | Estimation error in μ and Σ |
| Inverse volatility | wi=(1/σi)/Σ(1/σj) | Giving lower-volatility assets more weight | Correlation between assets |
| Information ratio | (Rp-Rb)/tracking error | Reward for active risk versus a benchmark | Short-period luck and style concentration |
| Rebalancing band | |current weight-target weight|≥band | Drift from the risk budget | Tax, trading cost and market impact |
 Wikimedia Commons
Market return at the core, limited experiments in satellites
Individual stock returns have a long right tail. Hendrik Bessembinder's U.S. market research found that a small share of stocks generated most long-run wealth creation. A narrow selection therefore increases the chance of missing the few large winners. A broad index belongs at the core not merely to accept the average, but to keep unknown future winners in the portfolio.
Satellites add a deliberate tilt in a limited size. Value, quality and momentum factors or directly researched stocks can fit here. S&P DJI reported that 79% of U.S. large-cap active funds lagged the S&P 500 in 2025, with weak persistence among prior winners. A satellite should not grow simply because an expert selected it. Its net excess return must compensate for tracking error.
Overlap between core and satellites matters. If a capitalization-weighted index already has heavy exposure to large technology stocks, adding an AI ETF and semiconductor shares can leave three products driven by one risk factor. Review the combined sector, country, currency, interest-rate and factor exposures rather than counting product names.
A value-quality-momentum composite
Quant strategies apply the same rule repeatedly. One illustrative composite is `0.35×value z-score+0.35×quality z-score+0.30×momentum z-score`. Value can draw on price relative to book value, earnings or cash flow. Quality can include profitability, growth, financial safety and payout, while momentum can use recent return.
Those weights are examples, not universal optima. Winsorization or another truncation rule may be needed so an extreme observation does not dominate the score. Raw financial ratios also mix business-model differences between sectors, which makes sector-neutral ranking worth testing. Momentum is often measured using returns from months 2 through 12, excluding the latest month as in Kenneth French's data, but it can suffer sharp losses during reversals.
A backtest should include delisted stocks, use only information available at the time, and deduct trading costs and taxes. Testing many variants and reporting only the winner invites overfitting. Out-of-sample results and stability under small changes in weights matter more than one maximum historical number.
What Buffett and Howard Marks share
Warren Buffett disclosed an instruction for his estate in Berkshire Hathaway's 2013 shareholder letter: put 90% of the cash in a very low-cost S&P 500 index fund and 10% in short-term U.S. government bonds. This was not an invitation to copy Berkshire's concentrated equity portfolio. It was an example of prioritizing low costs, broad diversification and a rule a nonprofessional investor could maintain.
.jpg) Wikimedia Commons
Wikimedia CommonsHoward Marks argues that a high return cannot be judged without asking how much risk was taken. Markowitz quantified volatility and covariance; Marks emphasizes loss potential and risk control that can stay hidden in good times. The approaches complement each other. Quantifiable risk can be managed with numbers, while liquidity shortfalls, leverage and structural loss deserve separate limits.
Their shared lesson is operating discipline rather than elaborate forecasting. Set low costs, understandable assets, bearable weights and a holding period that can survive an unfavorable market. A famous investor's list of holdings says less than the constraints and opportunities that investor declined.
Rebalance on drift, not just the calendar
Rebalancing is meant to restore the intended risk range, not to make a profit every time. Returning to target every month is simple but can create frequent trades. A threshold rule trades only when `|current weight-target weight|` exceeds a preset band. Vanguard's target-date-fund research compares the trade-off between transaction costs and allocation drift under calendar and threshold approaches.
An investor can also direct new contributions toward underweight assets. Fewer sales may reduce tax and trading costs. Tax rules differ by account and residence, so a technique described for a U.S. account should not be copied into a Korean account without checking local treatment.
 BlackRock Investment Institute
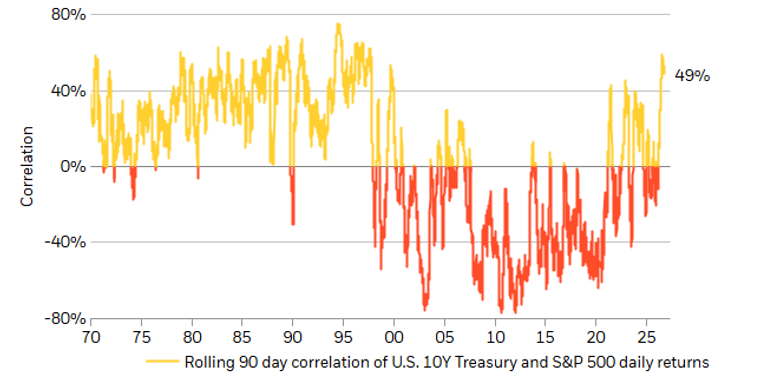
Stock-bond correlation should not be treated as fixed. BlackRock's chart through September 25, 2026 shows the rolling 90-day correlation between daily returns on the U.S. 10-year Treasury and the S&P 500. Long-duration bonds do not always move opposite stocks. Diversification is weak when differently named assets respond to the same shock.
A KRW 100 million risk budget
Consider a hypothetical KRW 100 million equity portfolio: KRW 70 million in a broad global index core, KRW 20 million in a value-quality-momentum satellite and KRW 10 million in directly researched stocks. This is not a recommended allocation. It is an example for making the loss budget visible.
If the direct-stock sleeve falls 50%, its contribution to the full portfolio is `10%×-50%=-5%`. A 2% portfolio cap for one stock limits its direct impact to -2% even if that stock becomes worthless. The core and factor sleeve can also fall in a broad selloff, so this calculation isolates only the individual-stock loss.
These figures must change with the investor's horizon, income stability, emergency reserve and total allocation to equities. A well-diversified brokerage account can still be too risky for the overall financial plan if living expenses are due soon.
Conditions for reducing or stopping a strategy
Abandoning a factor after a few weak months makes a long-term premium difficult to capture, but the phrase ‘long term’ does not justify every shortfall. A changed index methodology, weaker intended factor exposure, higher-than-expected costs or tracking difference, growing overlap, or a lower tolerance for drawdown can justify resizing.
A review sheet should contain annualized return, volatility, maximum drawdown, information ratio versus the benchmark, annual turnover and total cost. Improvement in one measure does not establish better performance if another deteriorates.
Five lines are enough to begin: time horizon and cash needs, core weight, total satellite and single-stock caps, rebalancing bands, and conditions for reducing the strategy. Quant formulas are the ruler used to inspect those rules; the masters' principles are the fence that helps preserve them. Using both reduces the risk of losing the portfolio while chasing a higher headline return.
Sources reviewed
The article was checked against the sources below. Image context and credits appear in each caption.